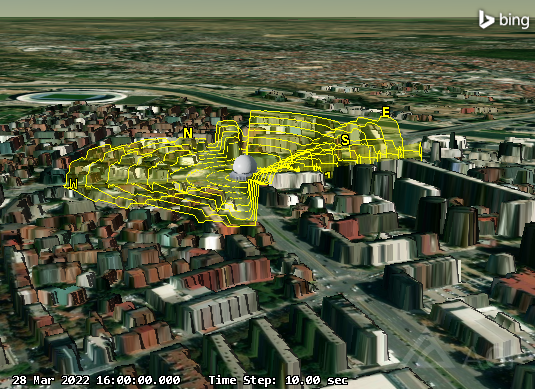
You can use shapefile data to visualize buildings in STK and for analysis using the Urban Propagation extension. However, to use the buildings for simple line-of-sight calculations, you must first convert the buildings to terrain data. Luckily, there are free GIS utilities that can convert shapefile data to raster data, which STK can then read as terrain data. If you're comfortable working with Python scripts, you can use the
gdal_rasterize function from GDAL's library.
For a more user-friendly experience, try the open-source QGIS project. Download and install the
latest release of QGIS from their website. Then complete the following steps:
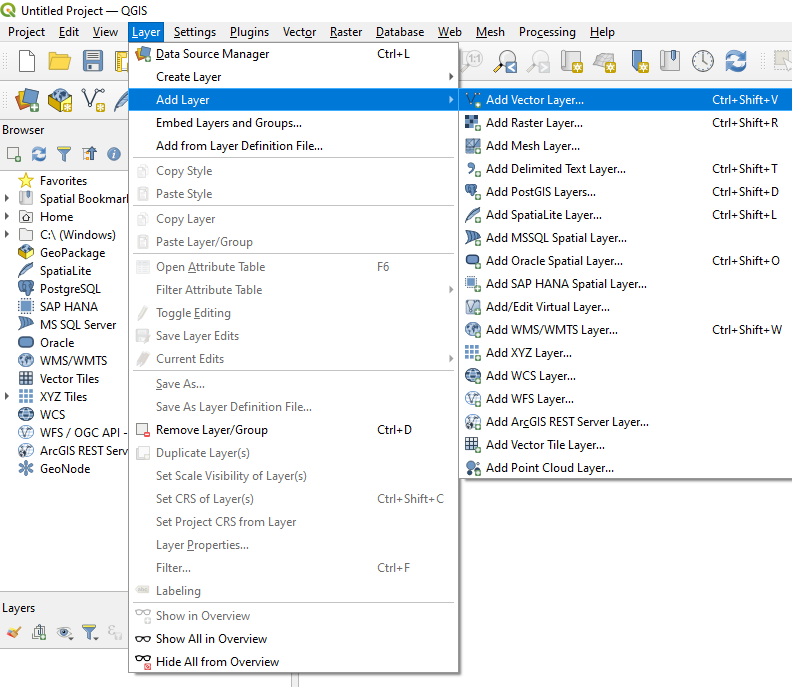
Add a layer
- Run QGIS Desktop.
- From the main page of the application, extend the Layer menu.
- Extend the Add Layer menu and select the Add Vector Layer… option.
Browse to the shapefile
- In the Vector Dataset(s) field, browse to your shapefile data and select the SHP file. Leave all the options as default and click Add.
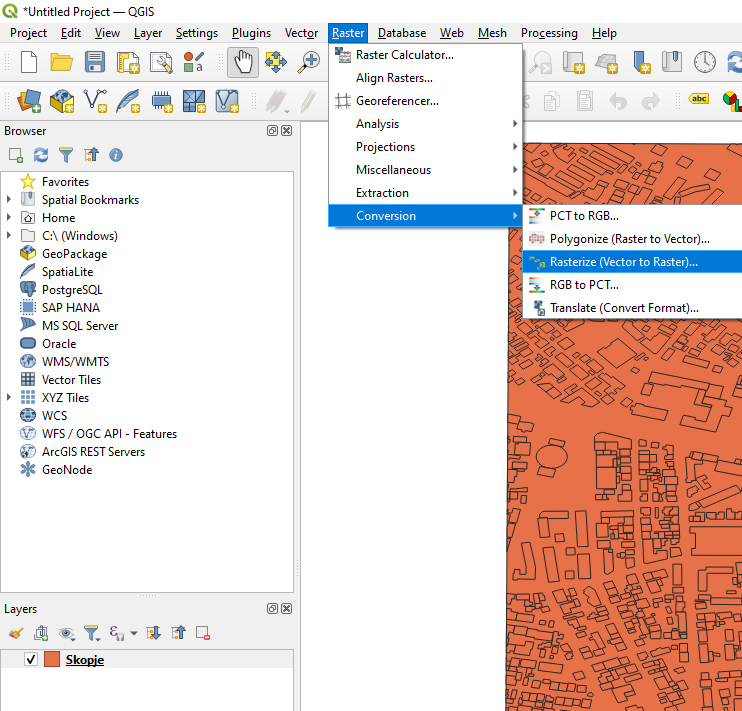
- After the data loads, you need to convert the vector data to raster.
- Extend the Raster menu.
- Extend the Conversion menu.
- Select the Rasterize (Vector to Raster)... option.
Select the correct attribute
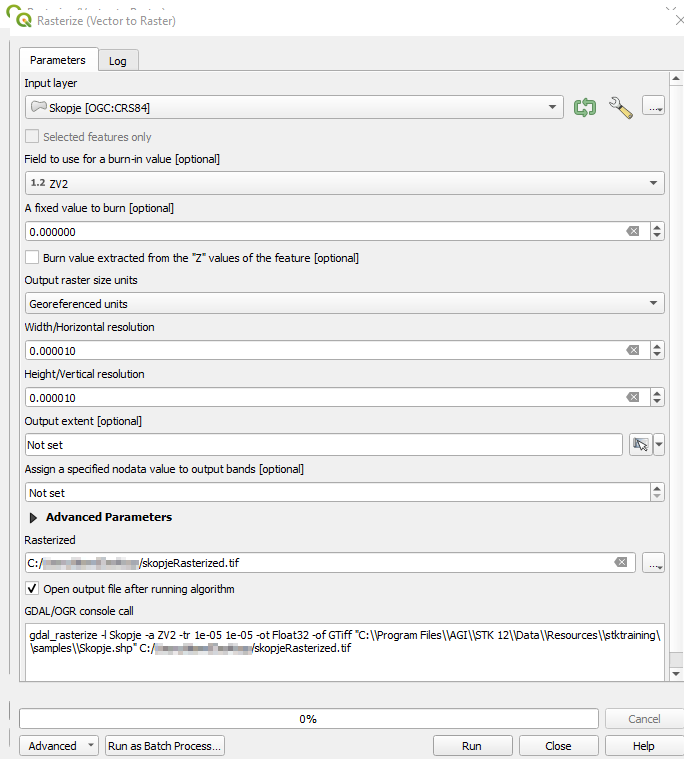
- In the Rasterize menu under “Field to use for a burn-in value,” make sure to select the attribute in the shapefile that contains the height values for the buildings. In this example, the value is ZV2. Commonly it is the ELEVATION attribute.
- Then in the Rasterized field, save the file as a TIF file to a location of your choice.
Select the raster resolution
- When you return to the Rasterize menu, select the “Georeferenced units” option for "Output raster size units."
- Assign the horizontal and vertical resolution. Higher resolution will take longer to process and result in a larger file, but will have smoother edges to the buildings. AGI recommends 1e-5 as a good starting resolution.
- Click Run.
Load the raster file into STK
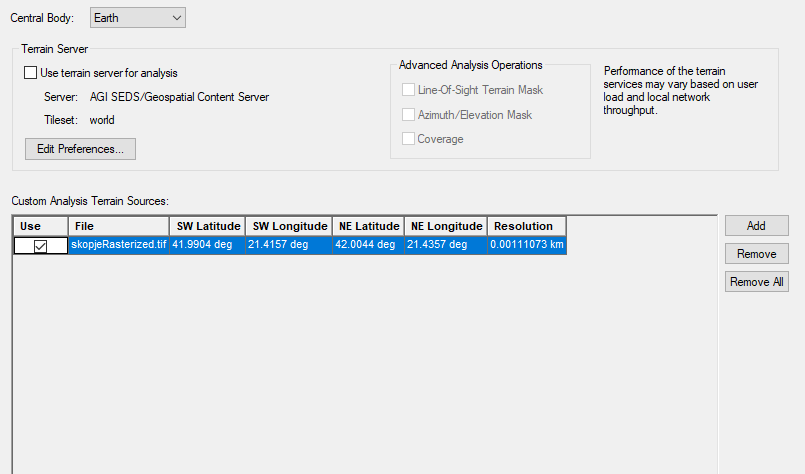
- After the raster finishes, load it into STK.
- Open the Scenario (
 ) Properties (
 ).
). - Select the Basic - Terrain page.
- Clear the "Use terrain server for analysis" check box.
- Add a Custom Analysis Terrain Source.
Create a PDTT file
- Extend the Utilities menu.
- Select the Imagery and Terrain Converter option to create a PDTT for the terrain data.
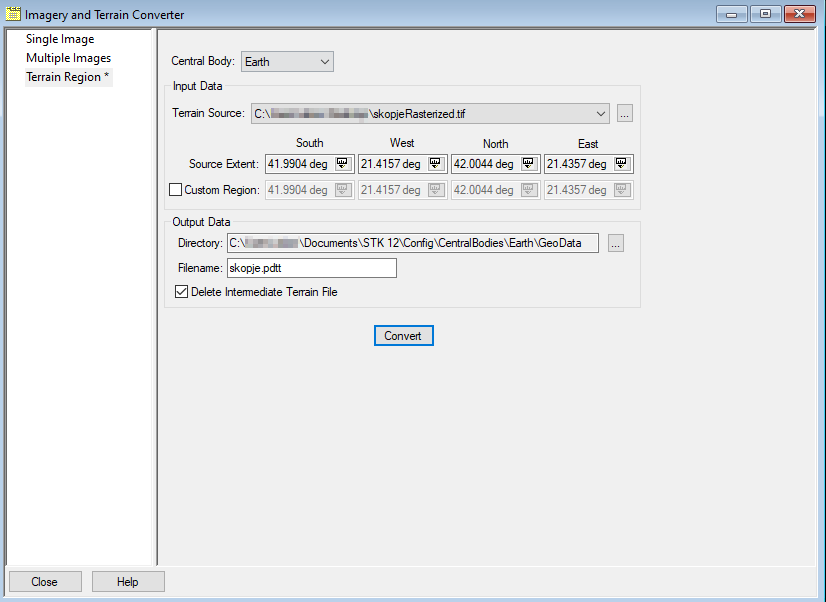
Add the newly generated PDTT file to your Globe Manager for visualization. You can now visualize and analyze the buildings’ effects on line-of-sight!
