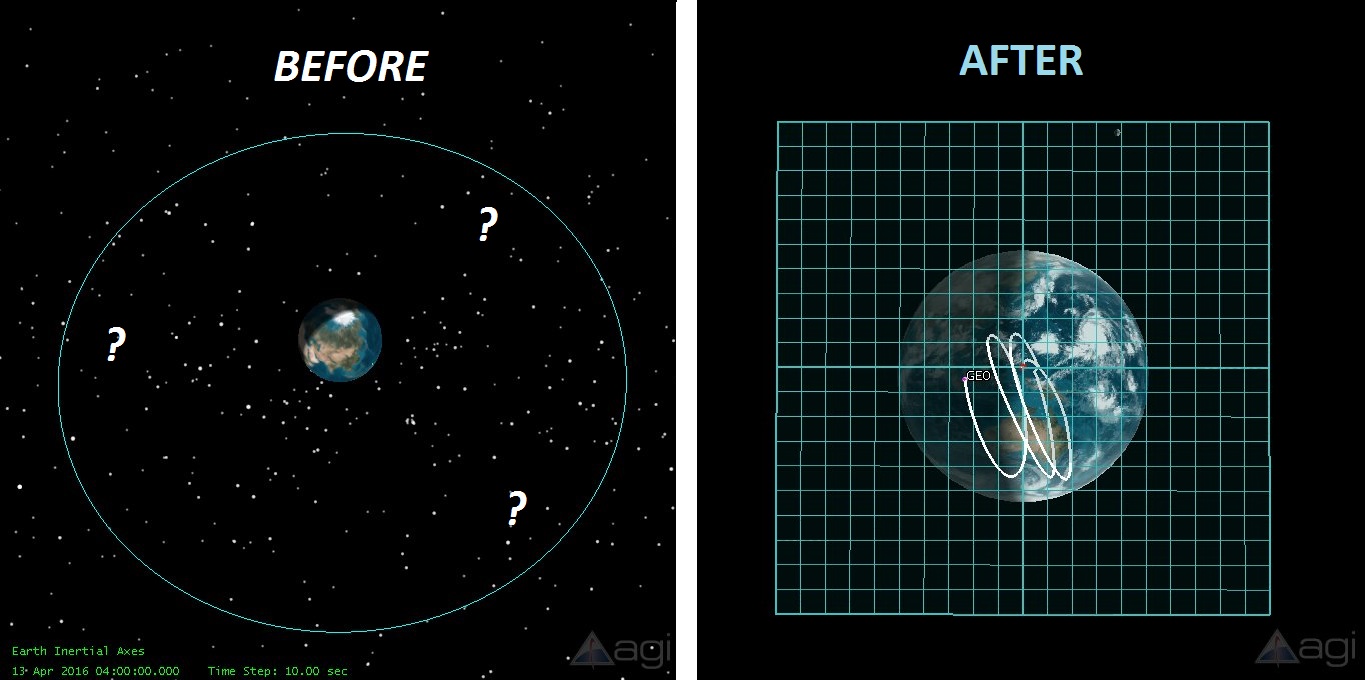
There are several ways of improving the visualization of a GEO satellite from its defaults. If you want to try to do it through the GUI, use the instructions below. If you want to use a MATLAB Script, then you can download the script here:
Geostationary Satellite Visualizer Helper . If you want to create your own script, use the sample script or the associated Connect Commands in the instructions below.
Note: Use of the script requires STK's
Integration and
Analysis Workbench capabilities included in STK Pro. For more licensing information, see the
licensing overview page.
 Instructions:
- Insert a Satellite using either the From External Ephemeris File method (you must have a geostationary satellite ephemeris ready) or the From Standard Object Database method.
- Open the properties of the satellite and perform the following:
- On the 2D Graphics page, you can increase the Line Width of the satellite orbit path.
- Go to 2D Graphics > Pass page; under Orbit Track:
- Set the Lead Type to None.
- Set the Trail Type to All or Time (2 days).
- Also on the 2D Graphics > Pass page, click [Resolution...]:
- Under Time between Orbit Points, set Maximum to ~ 100 seconds (too small will drop the frame rate).
- Go to the 3D Graphics > Pass page; under Leading/Trailing:
- Select the Inherit from 2D Graphics check box.
- Go to the 3D Graphics > Orbit System page:
- For Fixed by Window, select the Show check box.
- For Inertial by Window, clear the Show check box.
- Go to the 3D Graphics > Covariance page:
- Select the Show check box.
- Change Translucency to 50%.
You could perform all these property changes with the following Connect Commands:
- Graphics */Satellite/* Basic LineWidth 5
- Graphics */Satellite/* Pass2D OrbitLead None OrbitTrail All
- Graphics */Satellite/* Pass2D Resolution MaxOrbit 100
- VO */Satellite/* Pass3D Inherit On
- VO */Satellite/* OrbitSystem Modify System "InertialByWindow" Show Off
- VO */Satellite/* OrbitSystem Modify System "FixedByWindow" Show On
- VO */Satellite/* Covariance Basic Show On Translucency 50
- Find a Geostationary satellite's Geostationary Box
- Right-click the satellite and select Report & Graph Manager.
- Generate the LLA Position Report.
- In the LLA Report, right-click the Lon(deg) and select Longitude > Properties.
- In the Properties of the Lon(deg), to find the E/W Box component, do the following:
- Change Number of Decimal Digits to 6.
- Under Summary Options, select the check boxes for: Max / Min / Mean / Summary Only.
- Repeat this last step for Lat(deg) to find the N/S Box component.
- In the Report (with more decimal digits and Summary turned on), find the Min/Max/Mean Longitude and Min/Max/Mean Latitude. This is the region that this satellite will orbit in (during that interval). Long-term trending will need to be completed to determine the overall operating Geobox, but with a well-maintained orbit, you can accurately determine this box with less than one month of data.
- You can create the report using the following Connect Command:
- ReportCreate */Satellite/* Style "LLA Position" Type Display
- Create a view in fixed space at the Geostationary box location:
- Create a dummy facility at the Geostationary location.
- Create a default Facility and name it "GoodView".
- Open the properties of GoodView and go to Basic > Position. In the Position section:
- Set Latitude to 0.
- For Longitude, use the longitude of the satellite.
- For Altitude, use the altitude of the satellite and clear the Use Terrain check box.
- Hide GoodView from view by clearing the check box next to it in the Object Browser.
- In GoodView's properties, on the Constraints > Basic page, clear the Line Of Sight check box.
- You can create the dummy facility using the following Connect Commands:
- New / */Facility GoodView
- SetPosition */Facility/GoodView Geodetic 0 **Lon** **Alt**
- Note: You must enter the **value** for Lon and Alt from the LLA report you generated.
- Create a Geostationary Box (Square 100km):
- Go to Analysis Workbench and select Facility/GoodView. Then perform these steps:
- Click the Create New Plane icon.
- In the new GUI, change the name to "GeoBox".
- Leave all other properties the same.
- Go to GoodView's properties:
- On the 3D Graphics > Vector page:
- Select the Planes tab.
- Click [Add...], select the facility on the left, and select the new GeoBox Plane on the right.
- For the GeoBox Plane:
- Select the Show Axis Labels check box.
- Select the Translucent Plane check box and set the value to 80% or 90%.
- Set the Size to 10.
- Select the Show Rectangular Grid check box.
- In the Common Options section, under Component Size, set Scale to 4.
- When comparing Scale versus Size:
- With Scale of 4, it makes the plane of Size 1 = 10 km because the scale is logarithmic. The original size is 1 meter. Log Scale to 4 makes the size 10 km=(1 meter x 10^4). Then use the 'Size' to multiply this value. Normally, 100 km is large enough for GEO box.
- OverallSize = Size * 10^Scale (meters)
Use the following Connect Commands to create a Geostationary box:
- VectorTool * Facility/GoodView Create Plane GeoBox "Normal"
- VO */Facility/GoodView SetVectorGeometry Add "Facility/GoodView GeoBox Plane" Show On Translucent On Translucency 0.8 PlaneSize 10.0 ShowAxisLabel On ShowRectGrid On
- VO */Facility/GoodView ScaleLog 3
- VO */Facility/GoodView ModelDetail Set ModelLabel .001
Note: If you do not have access to Analysis Workbench, you do not need to create a new plane. Simply use the BodyXY Plane and then use the "go To GoodView's Properties" instructions to view.

