Sometimes you may want to display data from reports on the 3D Graphics window, but the label for the data may be too cumbersome or not exactly what you want for a presentation. This tutorial provides a method to solve this by using an example displaying Epoch Seconds and Epoch Minutes. You can apply this procedure using any data provider or imported set of data.
Create reports for EpSec and EpMin
To display the time, first go to the Report & Graph Manager and create a new report for some arbitrary object in your scenario; this tutorial will use an arbitrary satellite.
1. Rename the report "EpSec and EpMin".
2. In the properties for the report, find a data provider (like Attitude Segment Quaternions) that has Time and move ( ) it to the right side.
3. With Time highlighted in the Report Contents, click Units... under Report Contents.
4. Uncheck Use Defaults.
5. Select EpSec.
You can include other time providers like EpMin in a new section in the same report. STK will automatically put the second section on a line below the first when it's displayed in the 3D Graphics window. Alternatively, you can create a new report for another data provider. It depends on how you want it arranged. For simplicity, this tutorial will add EpMin as a new section on the same report.
1. Click New Section.
2. With the data provider you used previously still maximized, move ( ) Time over to the right side again.
3. With the new Time parameter highlighted in the Report Contents, click Units... under Report Contents.
4. Uncheck Use Defaults.
5. Select EpMin.
6. Click OK.
7. Click OK again.
Now you can add the report to the dynamic data display in the 3D Graphics window.
Add Data Providers to the Dynamic Data Display on the 3D Graphics window
1. Open the default satellite’s properties.
2. Go to the 3D Graphics – Data Display tab.
3. Click the Add… button.
4. In the Add a Data Display window, scroll down until you see EpSec and EpMin, click on it, and click OK.
5. Uncheck Title in the Appearance field.
6. Click Apply.
Your 3D Graphics window should look like this:
On the 3D Graphics – Data Display page, you can customize the position, font, format, title, and background of your data. The title is different from the label, though. The title automatically names the report and the object that the report is associated with. The label, however, is the combination of the Data Provider and the units used for it, as shown above. Unlike unchecking a box to change the title, to change the Label for the data display — for example, change Time (EpSec): 0.000 to Time (Sec): 0.000 — you will have to do some extra steps.
Change the label of the data display
1. With the 3D Graphics - Data Display page still open, change the Format to No Labels.
2. In the Position field, change the X Origin to 95.
3. Click OK.
4. Go to the properties of the 3D Graphics window.
5. Go to the Annotation page.
6. Click Add… in the Text field.
7. Change the Name to "Sec and Min".
8. In the Text box, put the text as shown in the figure below.
9. Change the Position to Pixel.
10. Change X to 10 and Y to 10.
11. Click Add in the Intervals field; this will automatically add an interval for the entire scenario duration.
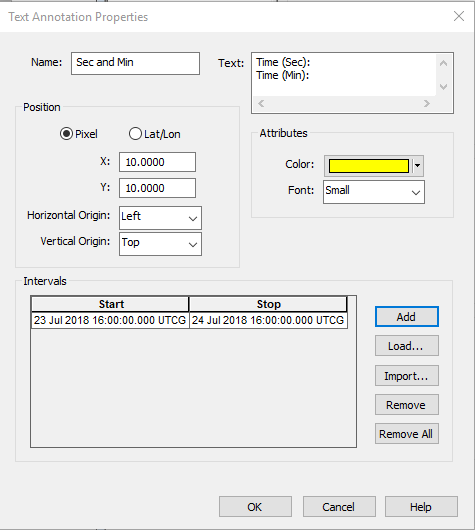
12. Click OK.
13. Click OK again.
Your 3D Graphics window will look like this now:
You can customize the color and the location of these displays too. To do the latter, you would have to make sure to coordinate the location of the measurement in the Satellite – 3D Graphics – Data Display page with the location of the label in the 3D Graphics – Annotation window page.
In addition, the appearance of the default annotations can be toggled on and off. For instance, in the 3D Graphics windows displayed above, there are no default annotations shown. To hide these annotations, you can uncheck the following boxes on the 3D Graphics – Annotation page as shown below.

