You can use STK to display any time-ordered data on the 3D Graphics window during scenario playback. For example, if you are provided post-flight or post-operation telemetry data that is critical to visualize during scenario playback, you can use it to help understand behaviors of your vehicle and its subsystems in a comprehensive 3D environment. There are two file formats available that accomplish this. Method 1 is preferred for its option to avoid using text files and instead sending data directly via code.
Method 1: External data / user-supplied data
SUMMARY:
Create a text file using the
External Data File Format. See the sample below, with two data fields named "bippy" and "zippy," also as shown
here. Read the text file into STK using a Connect command sent via HTML, the ButtonTool, or a COM application. Create a custom report style and display it in 3D Window. See detailed steps below.
External Data File Format example
stk.v.4.3
Begin DataGroup
    GroupName    My Data
    NumberOfPoints      3
    BlockFactor         50
    ReferenceEpoch      1 Jan 2001 00:00:00.000000000
    Begin DataElement
        Name          bippy
        Dimension     DistanceUnit
        FileUnitAbbr  Km
        InterpOrder   1
    End DataElement
    Begin DataElement
        Name          zippy
        Dimension     Rate
        FileUnitAbbr  ft
        FileUnitAbbr  min
        InterpOrder   1
    End DataElement

    Begin Data
    0.00000000000000e+00  5.03930000000000e+04  1000
    1.20000000000000e+02  4.84840000000000e+04  2000
    2.40000000000000e+02  3.23230000000000e+04  3000
    End Data
End DataGroup
IMPORTANT: The times in the data file are given as '
seconds past the reference epoch.' Be sure to set the reference epoch and generate your times accordingly.
Once you create the file, run a simple Connect command called "ExternalData". ExternalData <ObjectPath> {DataOption} [<Parameters>]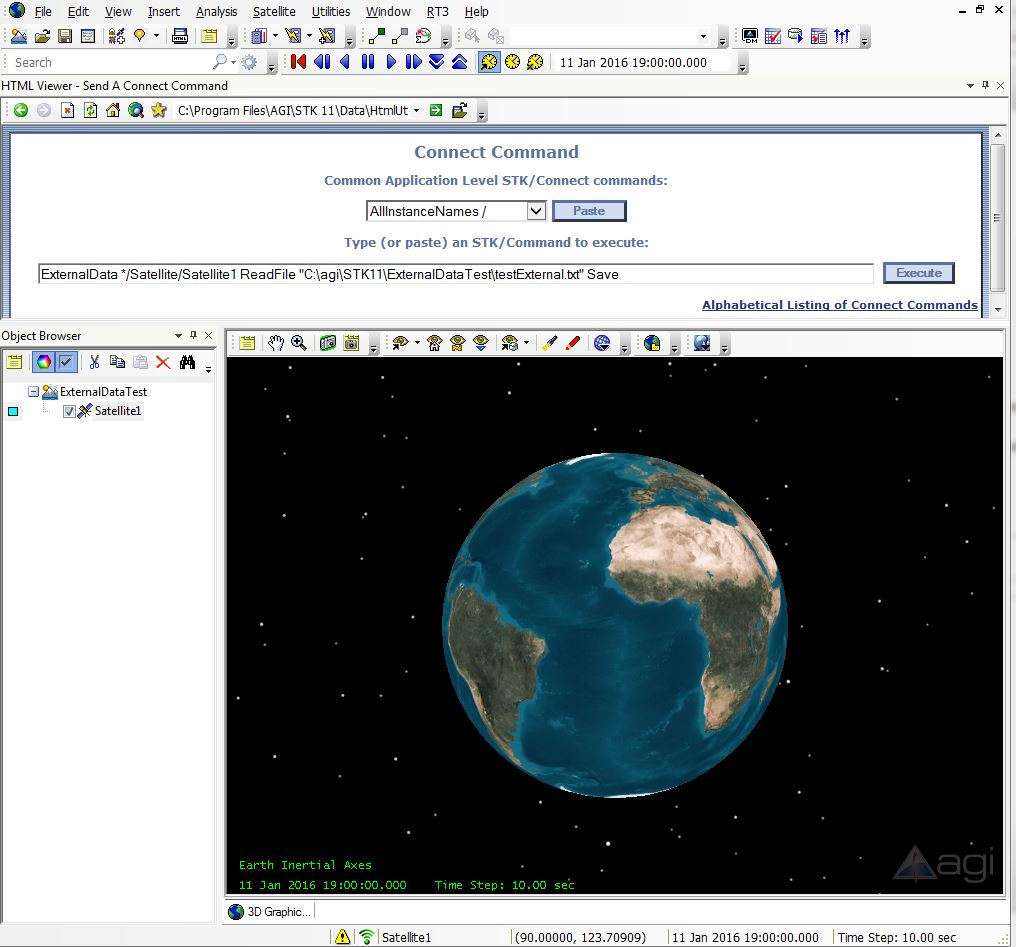
In the example above, the full syntax of the Connect command executed was:
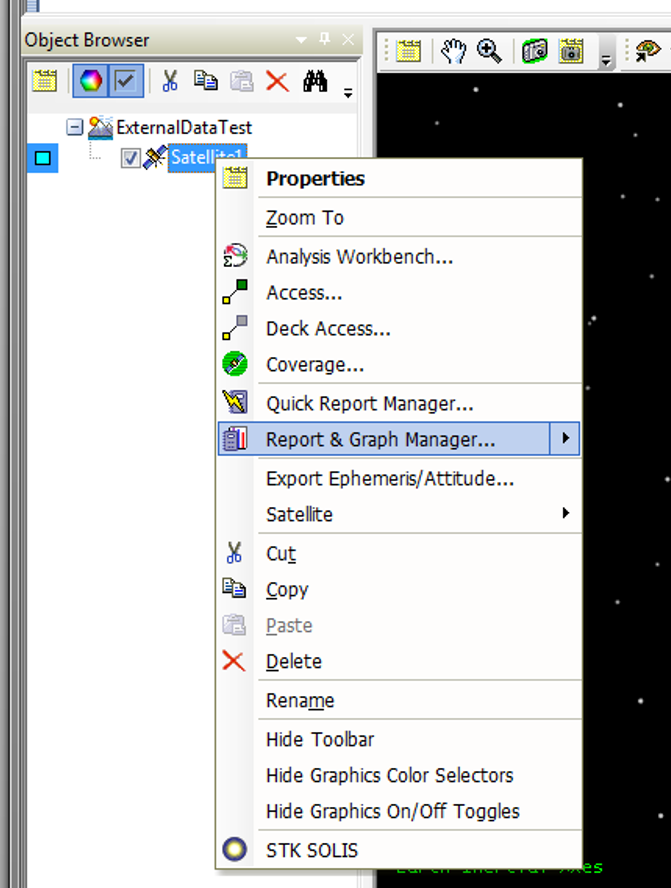
ExternalData */Satellite/Satellite1 ReadFile "C:\agi\STK11\ExternalDataTest\testExternal.txt" SaveNow that the data is read in and associates with the "Satellite1" object, you must generate a custom report of that data in order to display it on the 3D Graphics window. To create the report, open the Report & Graph Manager for the object of interest.
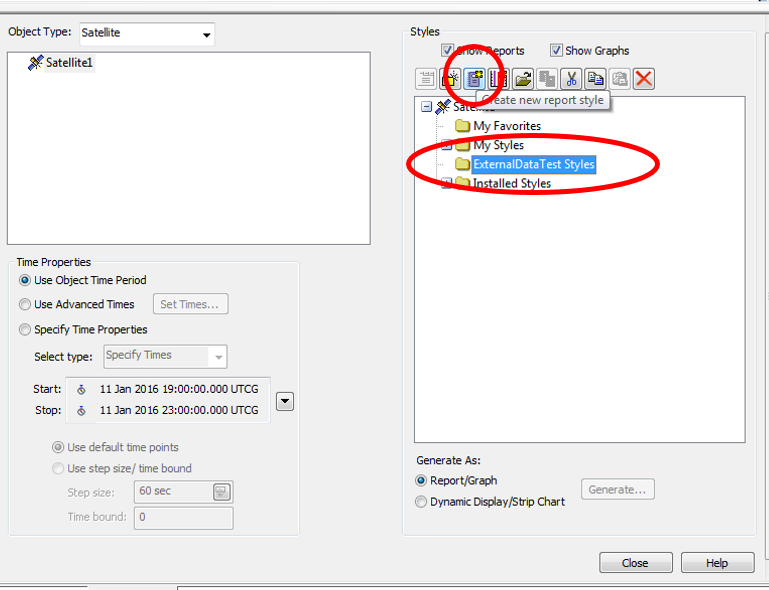
- Ensure that the object of interest is selected in the list of objects on the left.
- Select the folder on the right that has your scenario's name (ExternalDataTest in this example).
- Click the new report icon, circled in the snapshot below.
- Name the report and double-click it.
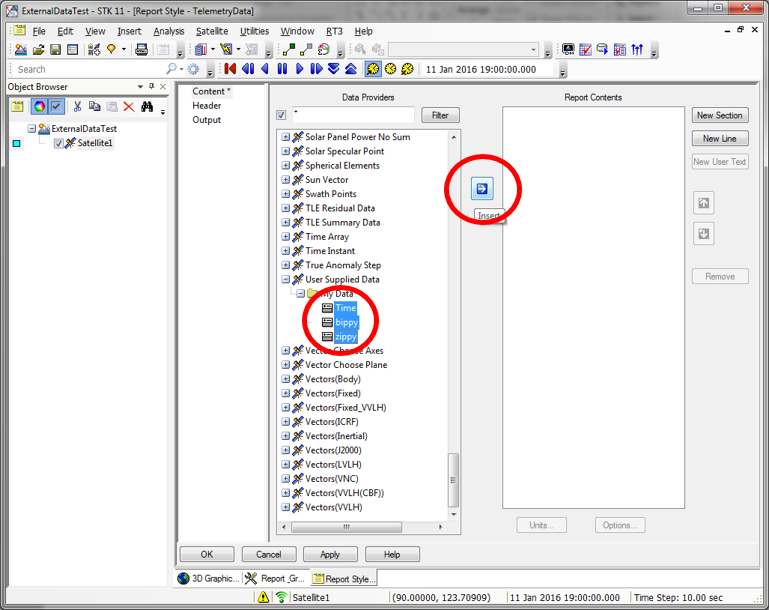
- In the Report Style window, STK provides a list of Data Providers for use in the new custom report.
- Expand the "User Supplied Data" provider. If the Connect command was successful, the external data elements should be listed.
- Select the data elements of interest from the external file.
- Click (
 ) to move the selected data elements into the report contents field and click OK when finished.
You can now generate a custom report to ensure your data looks correct.
Display the Report Data in the 3D Graphics Window
- Open the Properties for the vehicle of interest.
- Select the 3D Graphics - Data Display page.
- Click the Add button.
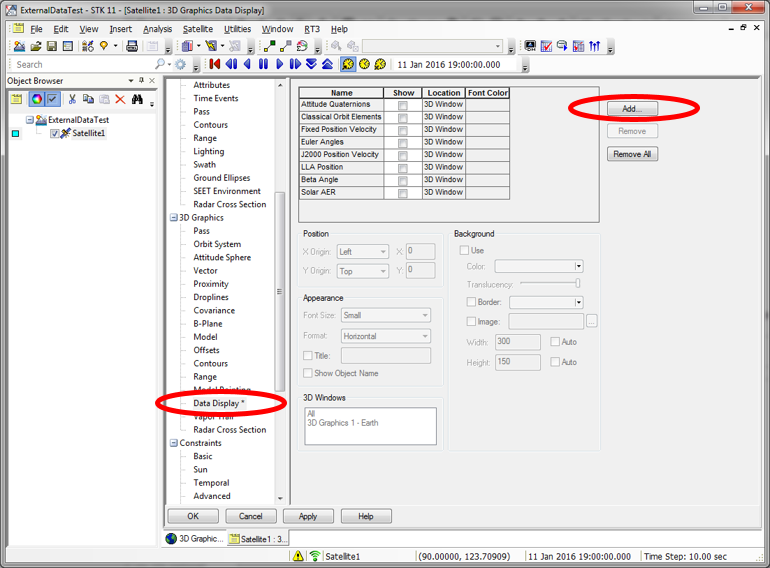
- Locate the custom report you created, select it in the "Add a Data Display" window, and click OK.
- You can then configure the position and visual aspect of that data in the 3D Graphics window. After this, click OK to apply the changes and close the window.
Method 2: Custom calculation scalar
SUMMARY
This method requires the use of Analysis Workbench. Convert your data into STK's *.csc format. This help link includes formatting options and interpolation methods. See a sample file here. Load the file into STK via the user interface or through code. Create a custom Report Style and display the contents in the 3D Graphics Window. See a finished example VDF with a tutorial by clicking here.
Follow these directions to add the file to the 3D Graphics window:
- Create or load a scenario with a satellite object.
- Open Analysis Workbench.
- Select the satellite object and open the Calculation tab.
- Create a new Scalar Calculation.
- Change the Type to File and name the file.
- Browse to the location of your saved *.csc file.
Now that you have the *.csc file loaded into STK, you can create a new report and add it as a data display.
- Right-click the satellite object in the Object Browser and open the Report & Graph Manager.
- Click the "Create new report style" icon.
- Give the report a new name and double-click it.
- Expand the Scalar Calculations data provider.
- Move () Telemetry Data to the Report Contents field and click OK.
- Open the satellite's properties.
- Select the 3D Graphics - Data Display page.
- Click the Add button.
- Select Telemetry Data from the list of Styles and click OK.
- Click OK to accept the satellite properties and close the window.

