The System Response Time figure of merit (FOM) is very useful in calculating the latency in data between several objects in a scenario. Access for a Chain requires simultaneous access between all members, but sometimes there are several objects that will be in a communications relay without the need for simultaneous access. This is when you should use the System Response Time FOM.
Consider the following scenario:
• A satellite
• An area target of interest that is being surveilled by a satellite
• A ground station that the satellite will downlink the area target data to
The satellite will not necessarily have access to the area target and the ground station simultaneously. Instead, the data is collected from the satellite and then sent to the ground station as soon as it has access. You want to capture the time latency of the data as an FOM for the area target.
Use the following steps to set up the System Response Time FOM:
- Open a new STK scenario.
- Insert a Satellite object with your desired orbital properties.
- Insert a Place or Facility object with your desired location to act as the downlink location. Of course the latitude of this object must be such that the satellite can see it long enough to download data.
- Insert an Area Target object with your desired properties. Again, the latitude of this object must be such that the satellite can see it long enough to collect data.
- Insert a Coverage Definition object using the Define Properties method.
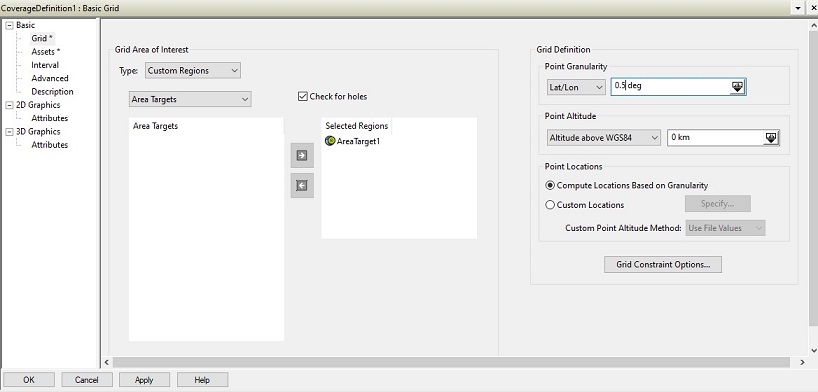
- On the Coverage Definition -> Basic grid page:
- Set the grid area of interest to Type = Custom Regions.
- Under the Type selection, use the drop-down menu to select Area Targets.
- Move the Area Target object you created from the left side Area Targets box to the right side Selected Regions box.
- Set the grid definition point granularity to a value that gives you an appropriate amount of grid points in the area target.
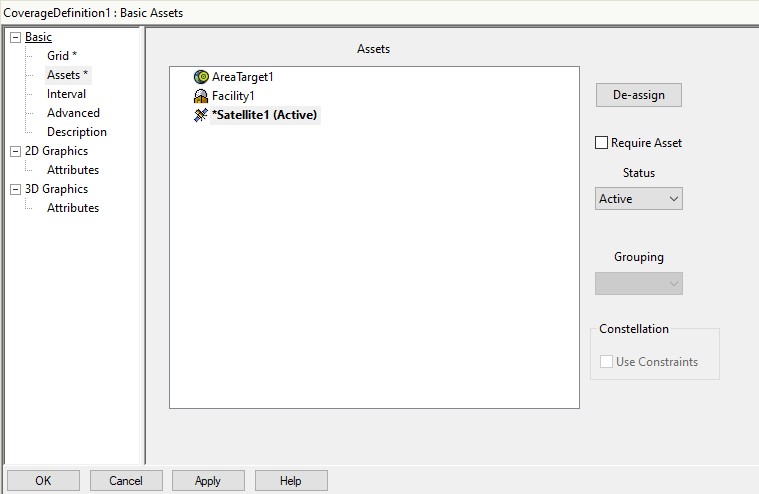
- On the Coverage Definition -> Basic -> Assets page:
- Select the Satellite object from the assets list.
- Click the Assign button so that the satellite status changes to active. This also changes the button to De-assign.
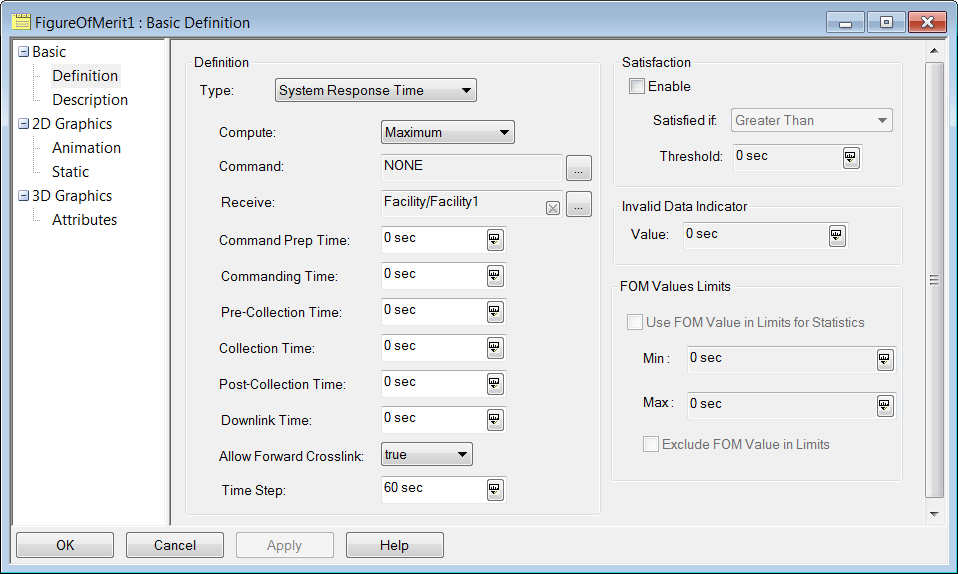
- Create a Figure of Merit object and set its Type to System Response Time.
- In the Receive field, select the ground station (Facility or Place object) that you want to downlink to.
- Set any of the communications time fields for the FOM as appropriate for your problem. For definitions of each of these fields, see thisdocumentation page in the STK Help.
- Compute the coverage for the Coverage Definition object by right-clicking it in the Object Browser and selecting CoverageDefinition -> Compute Access.
- Produce a Grid Stats or Grid Stats Over Time report for your FOM.
Easy modifications to the simulation:
• Instead of having just a satellite as the asset, you can have any object or constellation of objects as the asset.
• If there are two or more ground stations and facilities that you are interested in downlinking to, you can create a constellation of these object and assign the constellation as the receive object in step 5b. For help with Constellation objects in STK, check out this
tutorial.
Related Questions:
• What exactly is the system response time and why does it change over time?
• System response time is the time required between a commanded request for collection and the moment when the requested collection is available at the downlink station.
• During animation, the current animation time is considered to be the time of the collection request, so you are measuring how long you have to wait from the current animation time until you have a picture at the downlink station.
• Refer to the
System Response Time documentation page for more details as well as a diagram showcasing how STK calculates the system response time metric.
• What are the average, maximum, and minimum values in the Grid Stats or Grid Stats Over Time reports?
• Recall that the area target is populated with grid points. The average, maximum, and minimum values for a given time in the Grid Stats Over Time report are the average, maximum, and minimum as calculated for all the grid points in the area target.
• When defining the FOM, you select to compute either the average, maximum, or minimum value. The Grid Stats report will generate a minimum, maximum, and average value for the FOM. Again, these are the minimum, maximum, and average values over all the grid points. For example, if you want to compute the maximum value for the FOM, STK will compute the maximum over the entire simulation time for each grid point individually. Then these maximum values for all the grid points appear as a minimum maximum, maximum maximum, and average maximum in the Grid Stats

