These are instructions on how to create reference lines on a Time graph that you already created in STK.
Horizontal reference line1. For an access or object, go to Analysis Workbench in the Calculations tab and click the Create a new Scalar Calculation icon.
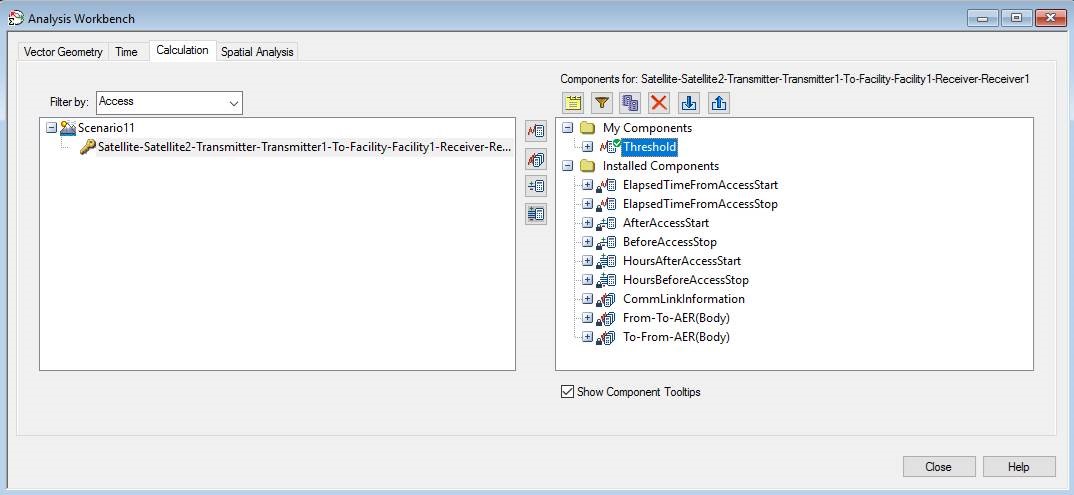
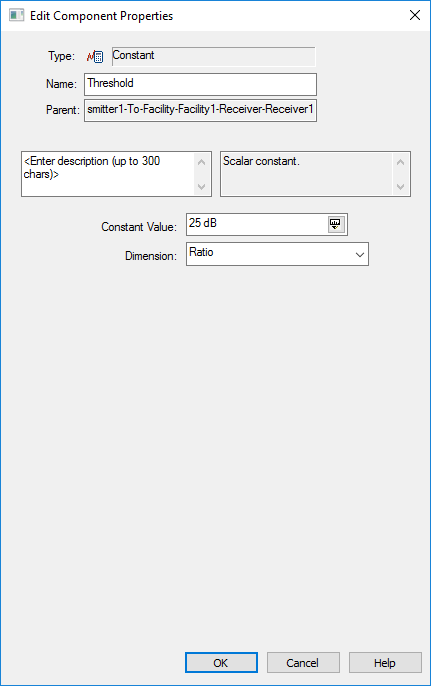
2. Set Type to "Constant" and set Constant Value to a threshold. Make sure the units are the same as the parameter to be graphed. Click OK to finish.
3.
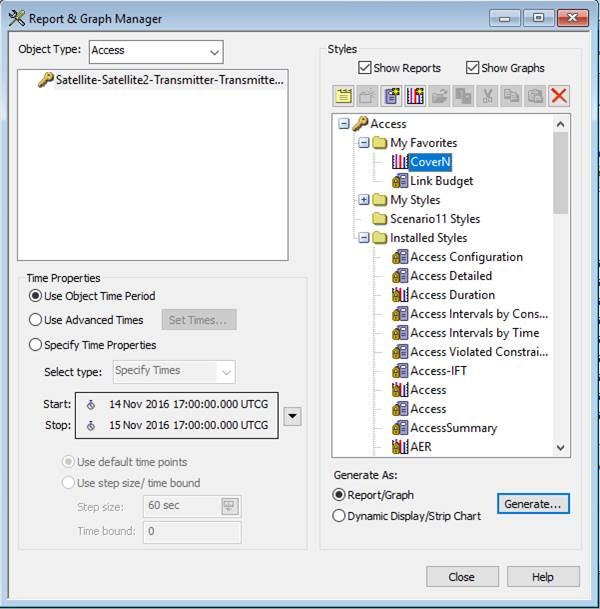
Make a custom graph style called CoverN in the Report and Graph Manager.
4. In the Graph Style contents, in addition to the parameter of interest, add the new scalar to the graph.
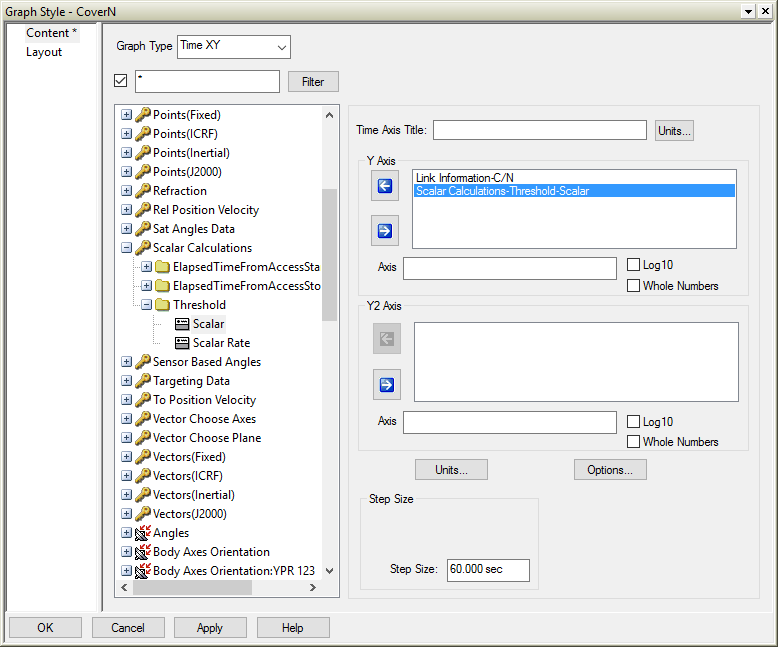
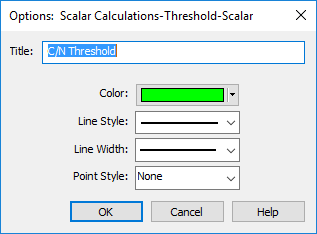
5. Right-click Scalar Calculations-Threshold-Scalar and select Options. Change the Title field to reflect that it is a threshold you are plotting; then click OK.
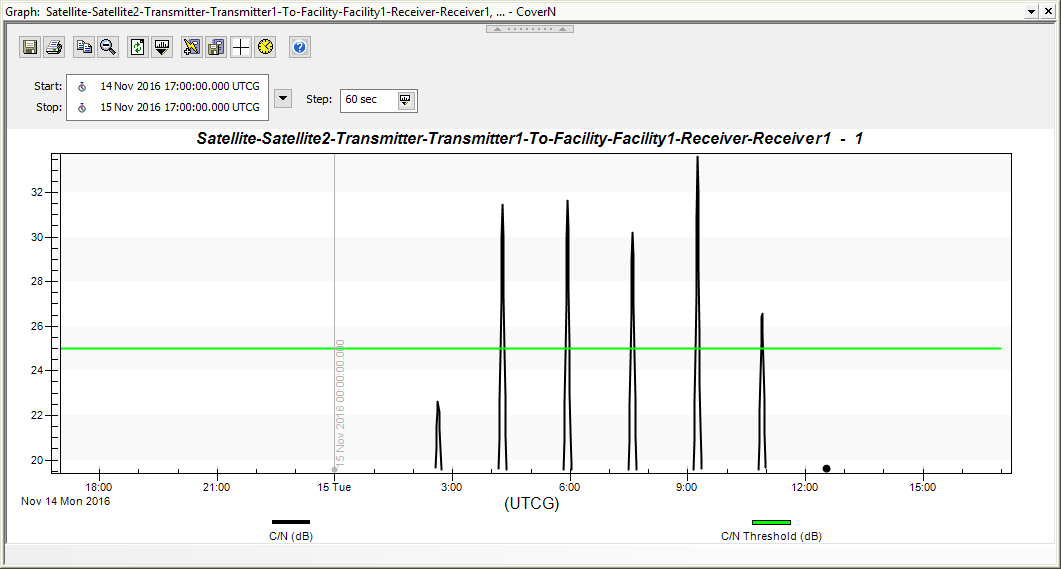
6. In Report and Graph Manager, keep CoverN highlighted and click Generate.
 Vertical reference line
For Time XY graphs, you can add a vertical reference line at a specific epoch by taking advantage of the signum function. The signum function is a mathematical function that extracts the sign of the input. For all negative numbers, the output of the signum function is -1. For all positive numbers, the output of the signum function is +1. You can use the discontinuity at T = 0 to create a vertical reference line in STK, following these steps.
1. In Analysis Workbench, under the Time tab, click the Create a new Time Instant icon. In the Add Time Component dialog box, set the type to Fixed Epoch, give it a name, and set the value of Epoch to be the time at which you want the reference line drawn in your graph.
2. Under the Calculation tab, click Create a new Scalar Calculation. Set Type to 'Elapsed Time' with the reference epoch set to the time instant you created in step 1.
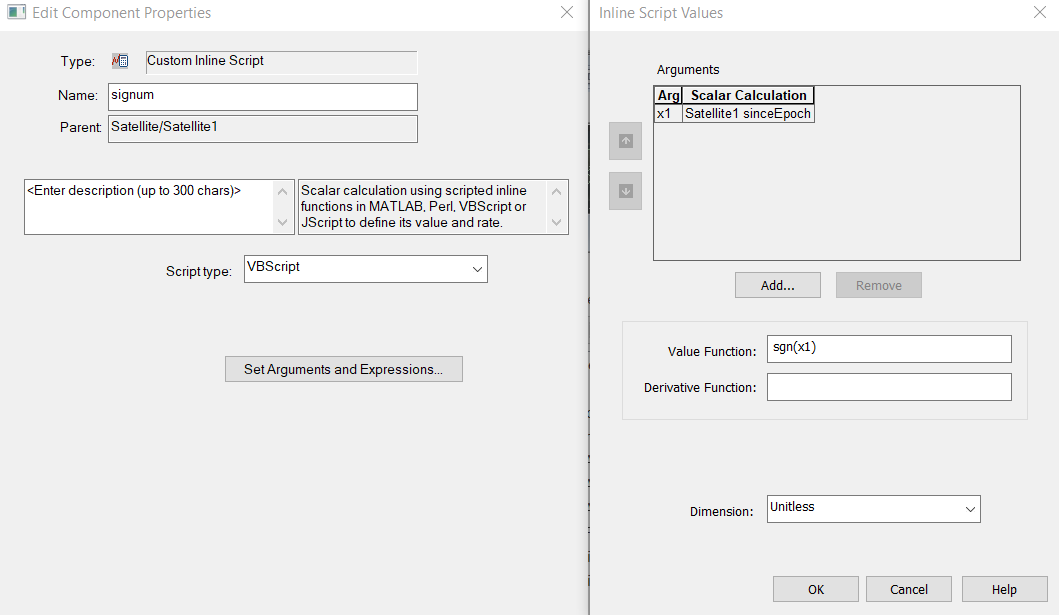
3. Again click Create a new Scalar Calculation and set Type to 'Custom Inline Script'. Set the language to VBScript, add an argument set to your elapsed time scalar calculation in step 2, and set the value function to the signum function (sgn in VBScript) of the input argument.
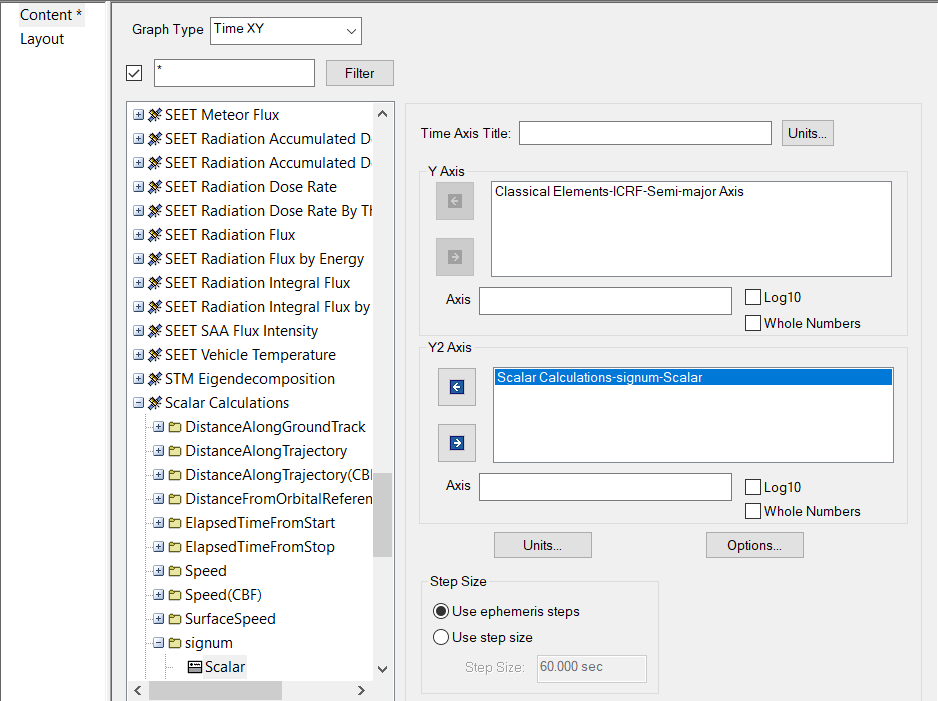
4. In your custom graph, add your signum scalar calculation to your graph in the Y2 axes to ensure that the scaling of your primary data of interest does not get scaled incorrectly.
5. Generate the report.

