A periodic square wave can be useful when doing design and analysis. You can use a function like this to set up an imaging pattern for a sensor, such as having it on for 5 minutes and then off for 10 minutes in a repeating pattern. You can also use it in conjunction with a scheduled vector to point a vector at one location for a period of time and then point it at another location for a period of time and repeat. It fits for any application that has a repeating on-off construct with a defined "on" time and "off" time.
By using a scalar calculation function in Analysis Workbench, you can create a square wave as an interval list component or interval list file within the Ansys Systems Tool Kit® (STK®) application, not as an external file to bring in as an input for the application. To do this, first create a sine wave as a base function, then apply specific "on" and "off" times, and finally use the on/off boundaries to create a square wave. Follow the procedure below.
Create a sine wave based on your on-off time
Add a scalar calculation
1. Create the object(s) in your scenario that you will apply the square wave to.
2. Open Analysis Workbench by right-clicking the object or from the Analysis menu.
3. In Analysis Workbench, select the Calculation tab and highlight your object in the left panel.
4. Click the top icon (Create new Scalar Calculation) in the middle section. A dialog box will appear.
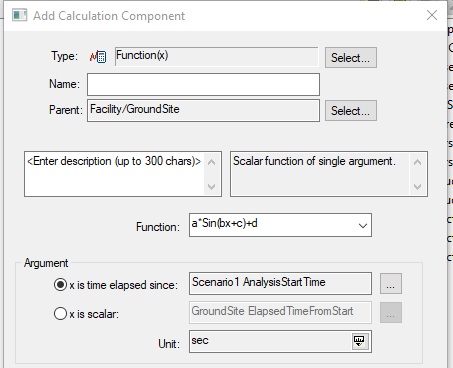
5. For Type, click the Select... button and choose Function(x).
6. Enter a name for your function (required).
7. Select the Parent (object) for which you want to create the square wave.
8. Change the Function value to a*Sin(bx+c)+d.
9. Leave the coefficients as the default for now.
10. Click OK to save these settings.
Display the function on a graph
1. With your object still highlighted on the left panel, right-click your scalar calculation function name in the right panel and select Report/Graph.
2. In the dialog box, for Type select Graph.
3. Click the Create Graph button. The sine wave should look like this:
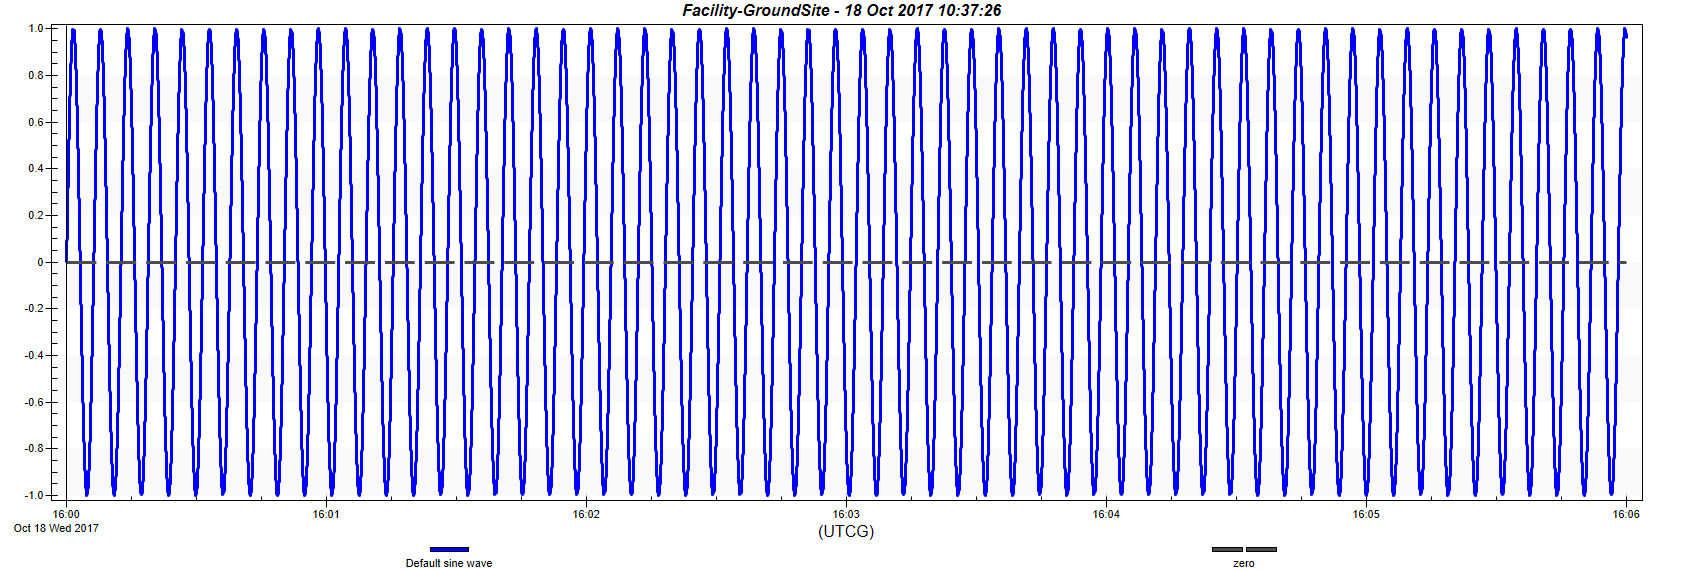
where amplitude = 1 and period = 2π
Apply On and Off times
Modify the sine wave to reflect the On time and Off time you want; this example uses 1 minute on and 5 minutes off. You can do this by adjusting the period. Instead of the period being 2π seconds, change it to period = On+Off (in seconds) by adjusting the coefficients as follows:
1. Right-click your function name in the right panel and select Properties to open the Edit Component Properties dialog box.
2. Calculate the b coefficient by dividing the default period by the desired period. So b=2π/(on time + off time), where the times are in seconds. For this example, the coefficients and graph should look like this:
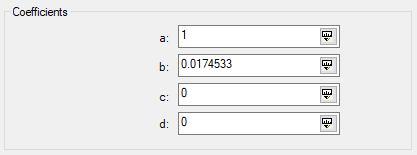
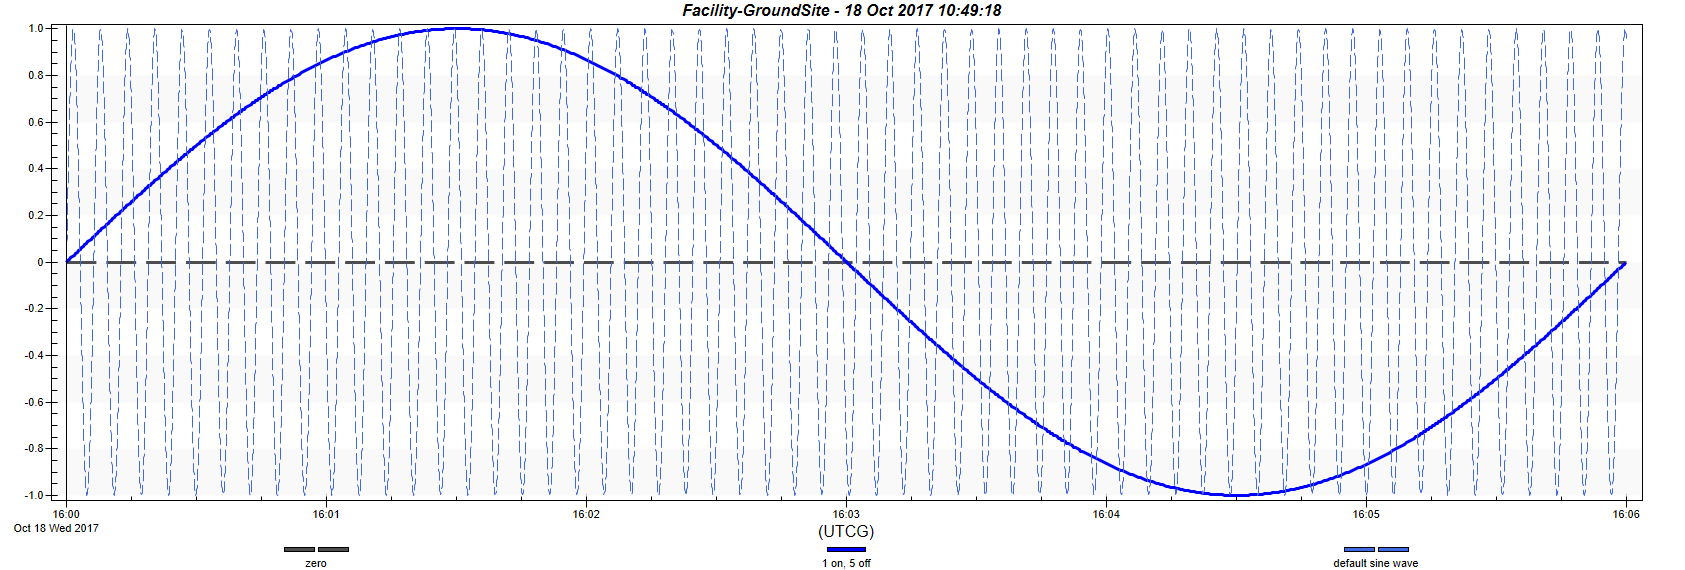
amplitude = 1, period = 6
Shift the sine wave to account for on time versus off time
Shift the overall wave so that only the one-minute on time is above an amplitude of 0. Do this by modifying the d coefficient. Since the amplitude is 1, you need to find the percentage of on time versus off time. This will be the decimal value you need to shift down. So d=-(1 - (on time)/(period)). Which gives us the following:
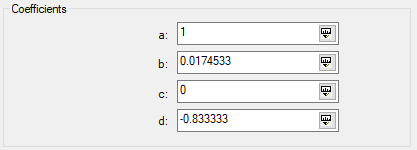
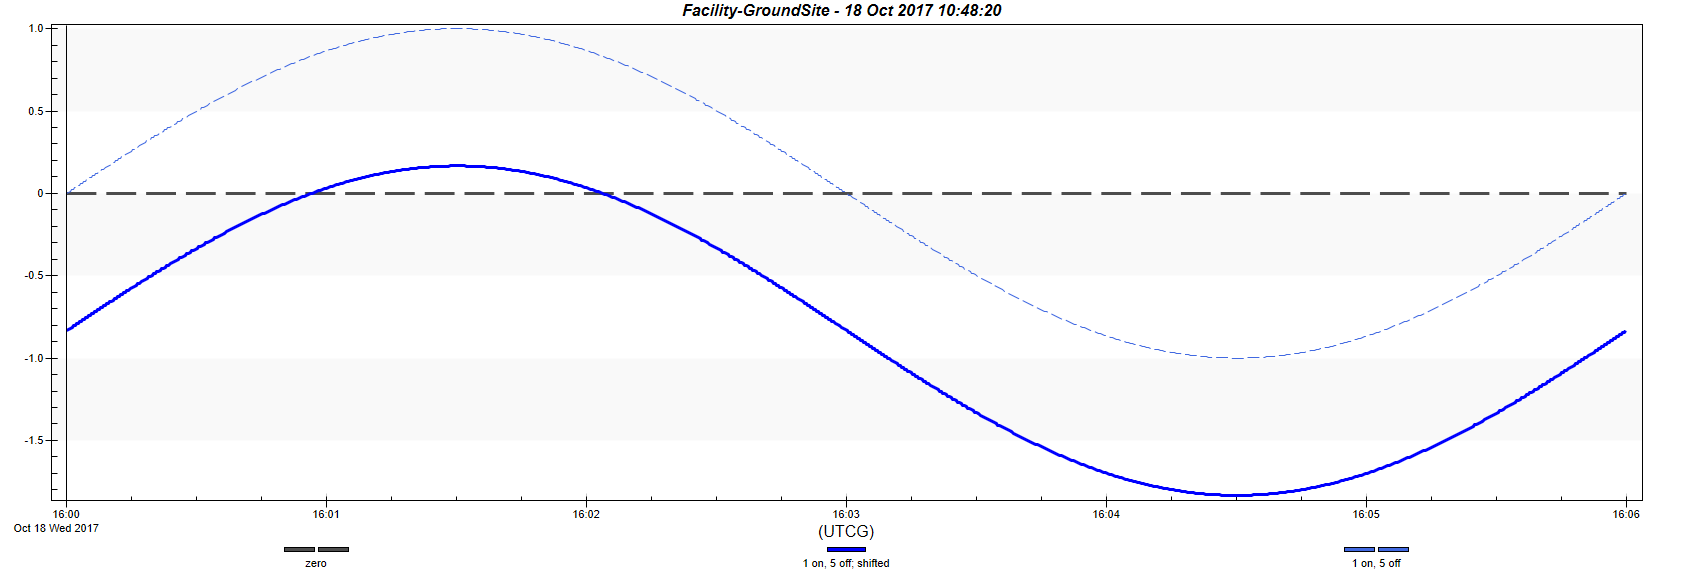
amplitude = 1, period = 6, notice the entire wave is shifted down
Turn your sine wave into a square wave
You now have everything set up so that you can create the square wave.
1. Again, click the top icon (Create new Scalar Calculation) in the middle section.
2. For Type, click Select..., expand Condition, and select Scalar Bounds.
3 For the Scalar value, click the ellipsis (...), ensure your object is highlighted on the left, select your sine function name on the right, and click OK.
4. Keep the Operation at Above Minimum and the Minimum equal to 0.
Performing your display steps as above gives you a final square wave that looks like this:
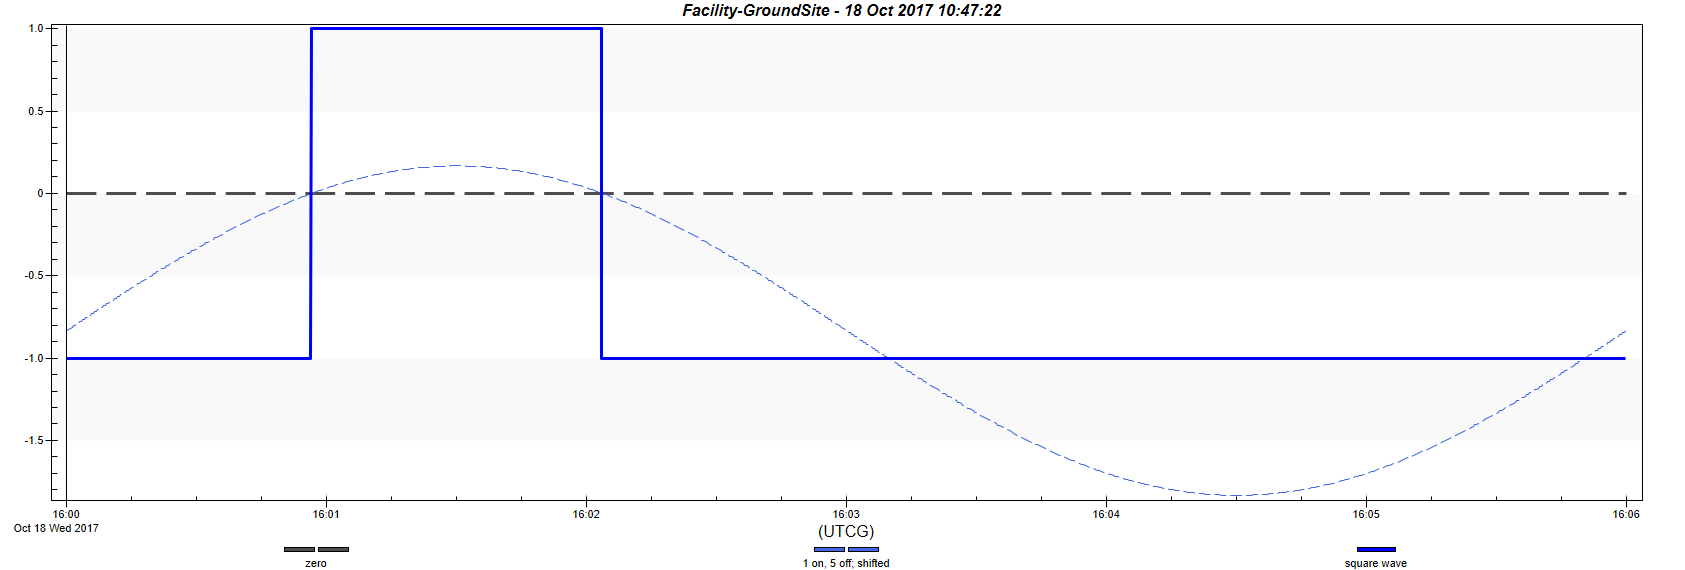
Square wave showing 1 minute on, 5 minutes off; showing 1 period
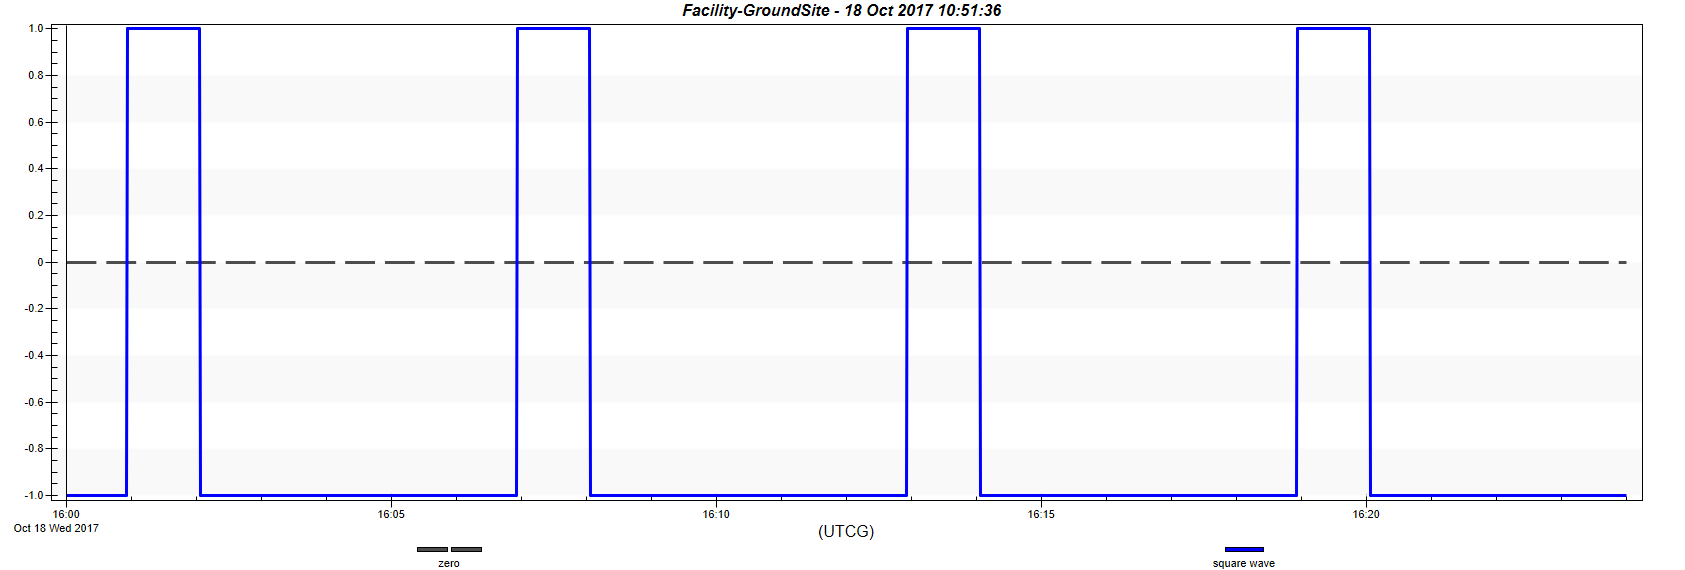
Square wave showing 1 minute on, 5 minutes off; showing 4 periods
You can then use this with a satisfaction time interval to create time intervals you can use as sensor constraints or to point vectors. You can also merge this time interval with other square wave intervals to create complex repeating patterns such as 30 seconds on, 2 minutes off for 1 hour; then 5 minutes on, 2 minutes off for 3 hours; then back to 30 seconds on, 2 minutes off for 1 hour; repeat.
