Suppose you want to study the effect of geographic placement of an object over another geographic region. For example, you may want to know where to place a new facility/sensor in order to get the best combined effect over an area of interest. You can use Analyzer's Design of Experiments (DOE) Tool to vary the placement of a new sensor and see the results on a Coverage Definition. Here are the steps to accomplish this:
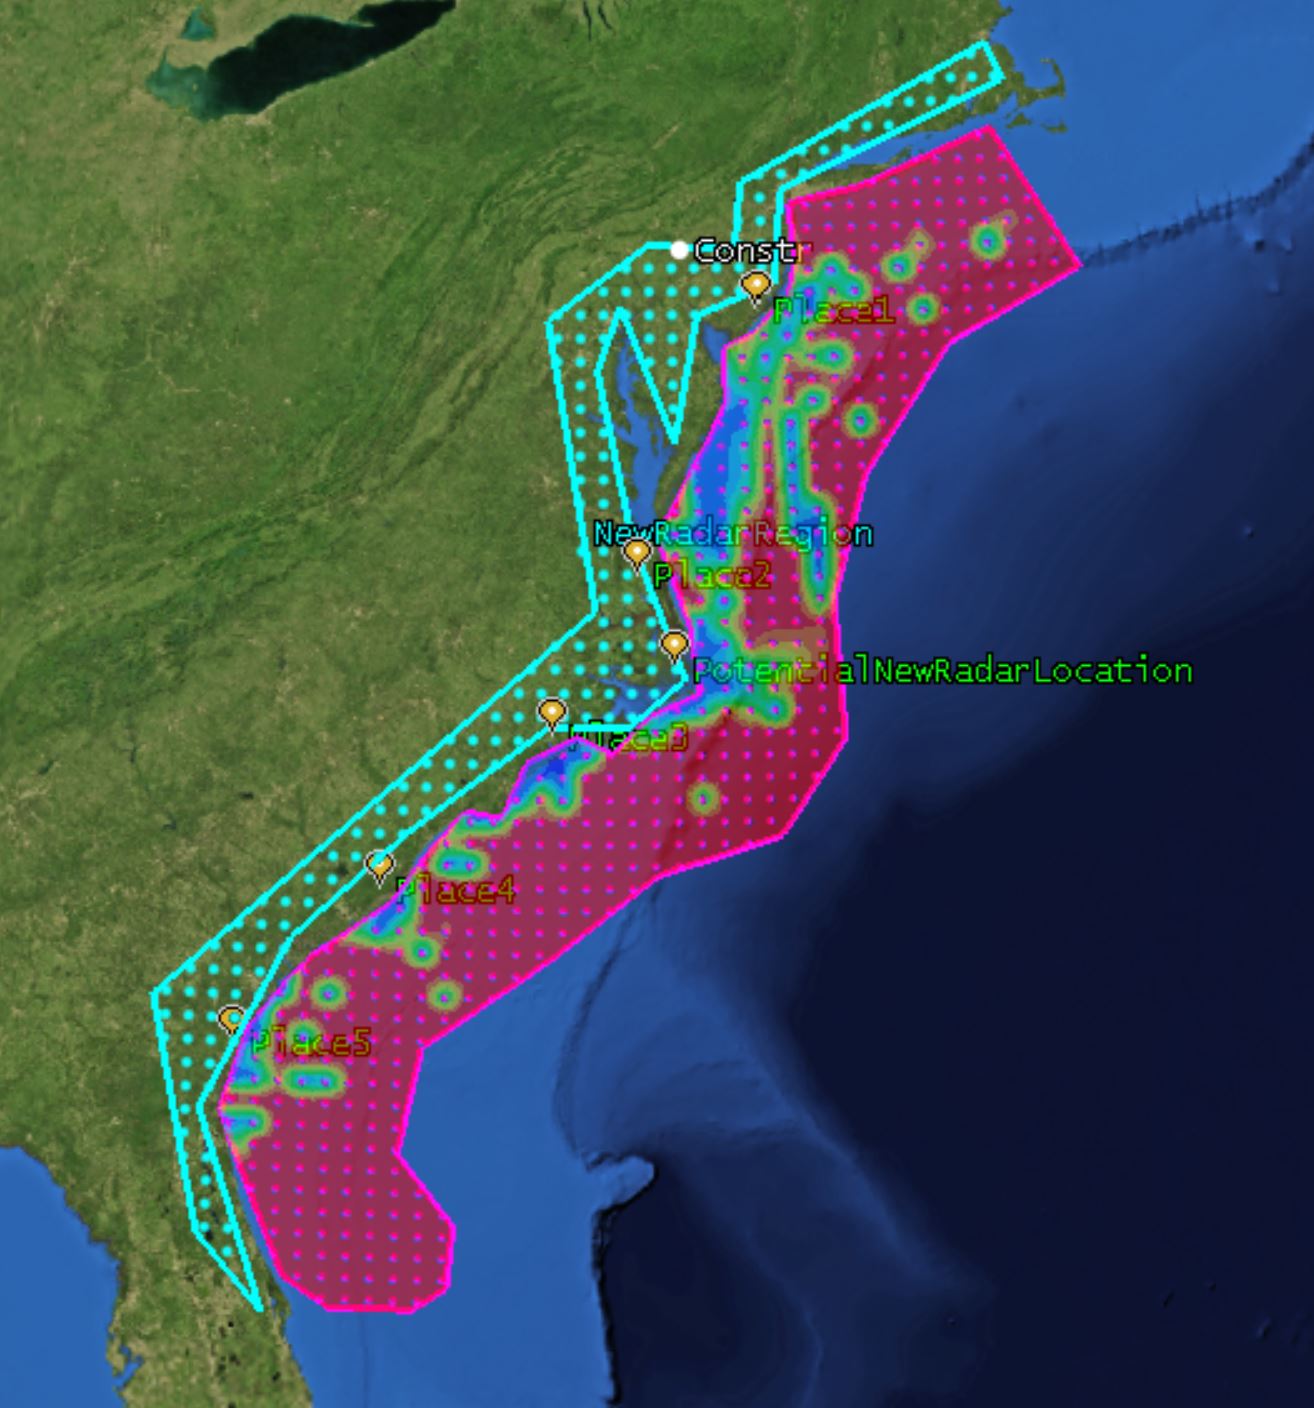
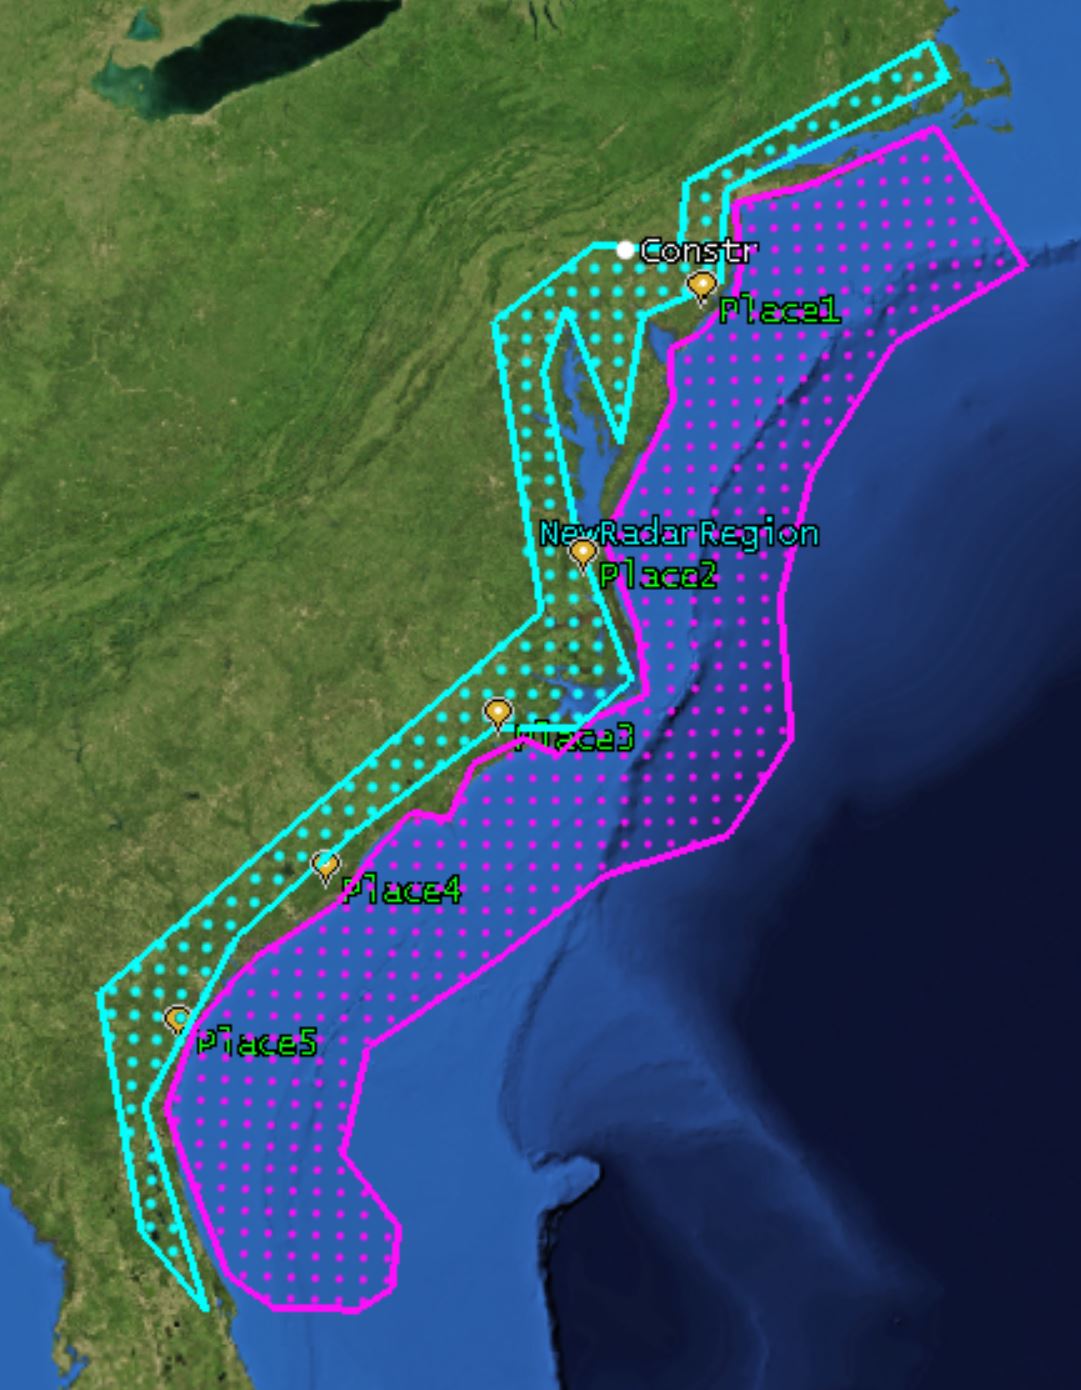
1. Create two Coverage Definition objects: One Coverage Definition object (aqua) represents the possible placement locations of your new sensor; call this "Sensor Placement". The second Coverage Definition object (magenta) is the actual area of interest, with its applicable FOMs defined; call this "Area of Interest".
2. You need the lat/lon points of the Sensor Placement Coverage Definition in order to use them as variables in DOE. Create a custom report with the Coverage Definition Grid Point Location data providers, and export that report as a CSV.
3. Insert a Place object and attach a Radar object to it.
4. Create a Figure Of Merit object and attach it to the Area of Interest Coverage Definition.
5. In Analyzer, create variables for the minimum and average overall values for the Figure of Merit, as well as the latitude and longitude of the Place object.
6. In the DOE Tool, drag and drop the Place object variables into the Design Variables window and the Figure of Merit variables into the Responses Window.
7. On the DOE Panel > Design Table tab, click Open to load your CSV values.

8. If you have not already removed the top row header of the CSV file that holds the latitude/longitude points of the sensor position grid, then remove those text inputs from the Design Table ("Latitude (deg)" and "Longitude (deg)") and run your DOE. Use the results to determine the optimal location for your new sensor!